Offshore Source is a web application for financial, economic, and alternative data sets, serving investment professionals. Offshore Source keep you updated weekly with relevant information concerning the Offshore Energy Sector.
Offshore web application aim is to share updates on the Offshore Energy Sector as well as the financial and economic data on a regular basis, So you can track the Industry Indicators, Stocks and Indices.
The new offshore website gives the user facility to access, compare, download and customize the data which is visible on the website. Users can view data and on mouse over see a short description with the view chart button.
What is The “View Chart” button?
After clicking on the view chart button, users can see a quick snapshot of data turnkey, of stock and index data, and end -of -day close numbers.
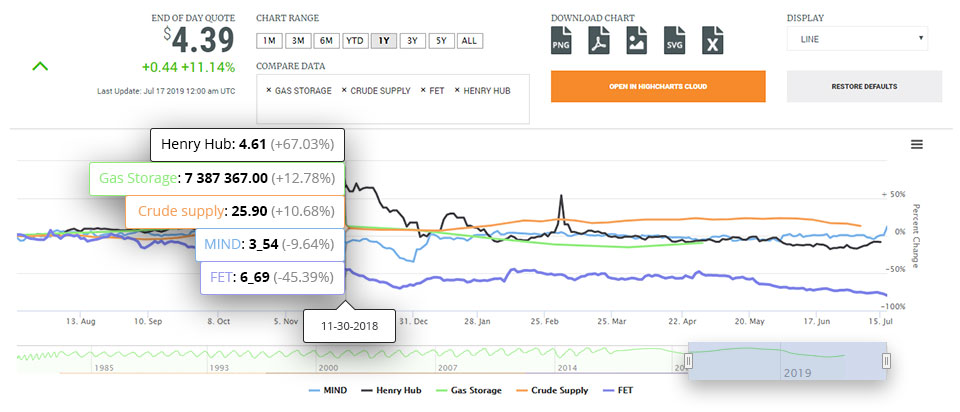
From chart range user can change the date range by simply clicking on any button. Under the download chart, the user can download png, pdf, jpeg, excel and svg formatted files of the data.
Under the display option, users can change the graph type by selecting a line or area to adjust.
Users can compare the single or multiple company data by selecting and add more company names from the drop down field. After adding the data, users can hover over the data to see comparisons. At the bottom of the chart, users can instantly change the date range by using the slider left and right or drag to select the particular data range.
Users can use the display button to change the chart style and see different data sets.
Users can select several companies to compare at once, or the user can view just one company’s data at a time. When users hover over the data, they will see the comparison pop up. Users can move to the bottom of the chart to change the date range, and the user can slide the date range until they see the data they need. Also, users can upload data to the High charts cloud.